ex6:SVM 前半 概述 在这个练习的前半部分,您将使用支持向量机(SVM)处理各种示例的2D数据集。通过对这些数据集进行实验,您将更好地理解支持向量机的工作原理以及如何在支持向量机中使用高斯核。在练习的后半部分,您将使用支持向量机构建一个垃圾邮件分类器。
前半部分文件:
ex6.pyex6data1.matex6data2.matex6data3.matsvmTrain.pysvmPredict.pyvisualizeBoundaryLinear.pyvisualizeBoundary.pylinearKernel.py
需要自己补充的文件:
导入 1 2 3 4 5 6 7 import matplotlib.pyplot as pltimport numpy as npimport scipy.io as sciofrom sklearn import svmimport plotData as pdimport visualizeBoundary as vbimport gaussianKernel as gk
from sklearn import svm 表示从 scikit-learn 库中导入支持向量机(SVM)相关的模块或类
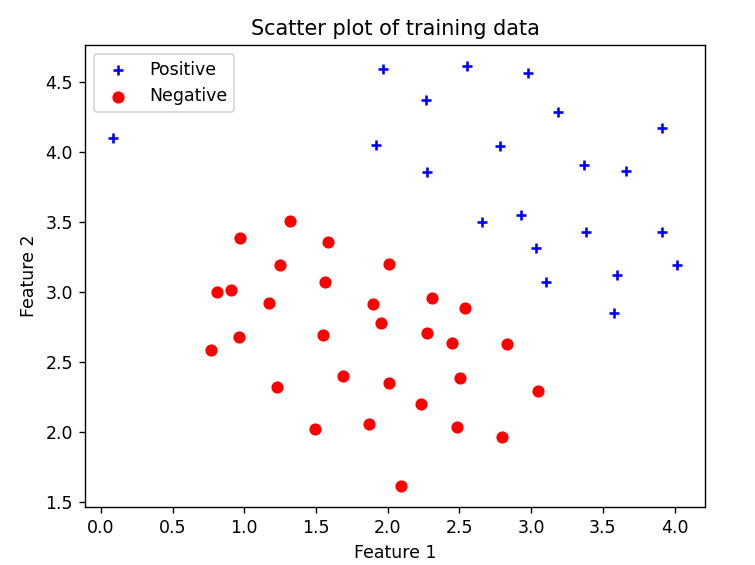
加载并绘图 1 2 3 4 5 6 7 8 9 10 11 12 13 14 15 16 print ('Loading and Visualizing data ... ' )data = scio.loadmat('ex6data1.mat' ) X = data['X' ] y = data['y' ].flatten() m = y.size pd.plot_data(X, y) input ('Program paused. Press ENTER to continue' )
这里需要写绘图文件plotData.py
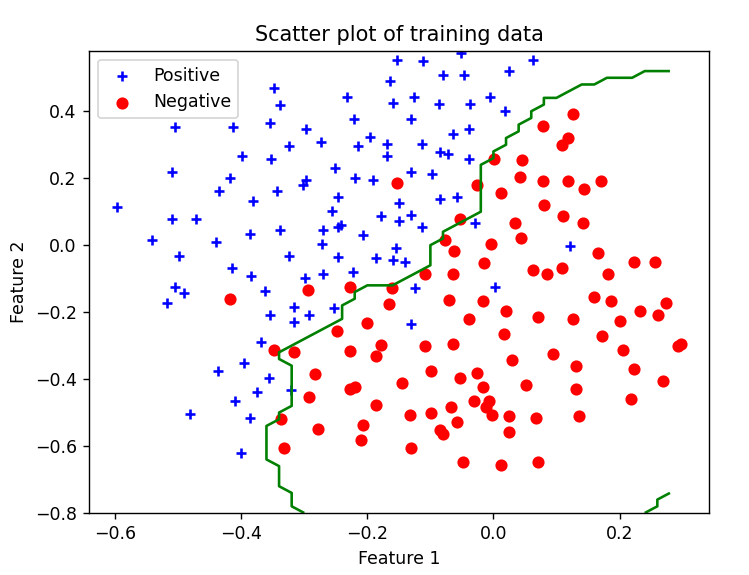
1 2 3 4 5 6 7 8 9 10 11 12 13 14 15 16 17 18 19 20 21 import matplotlib.pyplot as pltimport numpy as npdef plot_data (X, y ): plt.figure() positive_indices = (y == 1 ) negative_indices = (y == 0 ) plt.scatter(X[positive_indices][:, 0 ], X[positive_indices][:, 1 ], marker='+' , c='b' , label='Positive' ) plt.scatter(X[negative_indices][:, 0 ], X[negative_indices][:, 1 ], marker='o' , c='r' , label='Negative' ) plt.xlabel('Feature 1' ) plt.ylabel('Feature 2' ) plt.title('Scatter plot of training data' ) plt.legend()
positive_indices 和 negative_indices 是通过布尔条件来筛选出正例和负例的索引。在这里,y 是包含标签的数组,通常是 0 或 1。
positive_indices 是一个布尔数组,其中对应于 y 中值为 1 的位置为 True,其余位置为 False。negative_indices 是一个布尔数组,其中对应于 y 中值为 0 的位置为 True,其余位置为 False。
这两个数组可以用来从特征数组 X 中提取正例和负例的数据点。例如,X[positive_indices] 将给出所有正例对应的特征数据,而 X[negative_indices] 将给出所有负例对应的特征数据。
画出的图:
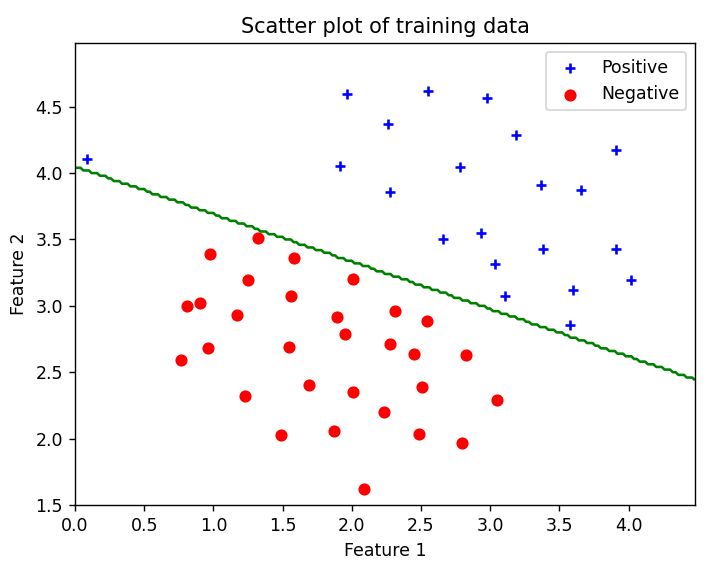
训练SVM 1 2 3 4 5 6 7 8 9 10 11 12 13 14 15 print ('Training Linear SVM' )c = 1000 clf = svm.SVC(C=c, kernel='linear' , tol=1e-3 ) clf.fit(X, y) pd.plot_data(X, y) vb.visualize_boundary(clf, X, 0 , 4.5 , 1.5 , 5 ) input ('Program paused. Press ENTER to continue' )
clf=svm.SVC(C=c, kernel='linear', tol=1e-3)参数的意义是:
C:float,默认=1.0 ,惩罚项的倒数。较小的 C 会导致更宽松的决策边界,而较大的 C 会导致更严格的决策边界。在训练过程中,C 控制错误分类的惩罚,即对错误分类的惩罚越大,模型越倾向于尽量正确分类每个样本。这里设置为1000
kernel:string,默认=’rbf’ ,这里设置为线性核
核函数的类型。常用的核函数有:
'linear':线性核'poly':多项式核'rbf'(默认):径向基函数(高斯核)'sigmoid':Sigmoid核
tol:float,默认=1e-3 ,容忍停止标准。训练迭代过程中的收敛容忍度。
clf :训练后的支持向量分类器。这个对象可以用于对新样本进行分类
clf.fit(X, y) 是支持向量机(SVM)分类器中用于训练模型的方法。在这个方法调用之后,模型会根据提供的训练数据 X 和对应的标签 y 进行学习,以找到一个最佳的决策边界(或超平面),以区分不同类别的样本。
例如,在线性核函数的情况下,clf.fit(X, y) 将学习一个线性决策边界,使得在特征空间中不同类别的样本被尽可能正确地划分。学习过程中,模型会根据训练数据调整参数,其中最重要的参数之一是 C,它控制了错误分类的惩罚。
训练完成后,模型就可以用于对新的未见过的样本进行分类,通过调用 clf.predict(new_data) 方法,其中 new_data 是新样本的特征
visualize_boundary函数是已经给出的,只需要直接调用
高斯核函数 1 2 3 4 5 6 7 8 9 10 11 12 13 14 15 print ('Evaluating the Gaussian Kernel' )x1 = np.array([1 , 2 , 1 ]) x2 = np.array([0 , 4 , -1 ]) sigma = 2 sim = gk.gaussian_kernel(x1, x2, sigma) print ('Gaussian kernel between x1 = [1, 2, 1], x2 = [0, 4, -1], sigma = {} : {:0.6f}\n' '(for sigma = 2, this value should be about 0.324652' .format (sigma, sim)) input ('Program paused. Press ENTER to continue' )
编写高斯核函数,完成gaussianKernel.py
1 2 3 4 5 6 7 8 9 10 11 12 13 14 15 16 import numpy as npdef gaussian_kernel (x1, x2, sigma ): x1 = x1.flatten() x2 = x2.flatten() sim = 0 x=-np.sum (np.power((x1-x2),2 ))/(2 *np.power(sigma,2 )) sim=np.exp(x) return sim
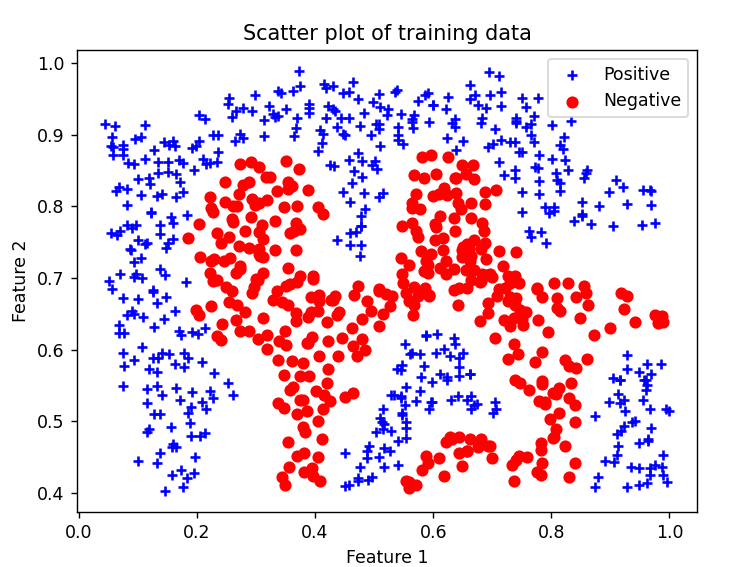
加载新数据并绘图 1 2 3 4 5 6 7 8 9 10 11 12 13 14 15 16 print ('Loading and Visualizing Data ...' )data = scio.loadmat('ex6data2.mat' ) X = data['X' ] y = data['y' ].flatten() m = y.size pd.plot_data(X, y) plt.show() input ('Program paused. Press ENTER to continue' )
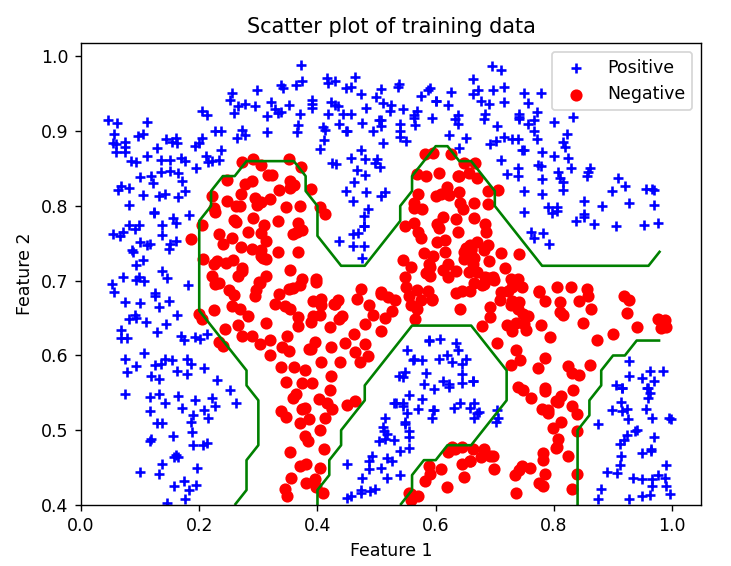
训练SVM(RBF) 1 2 3 4 5 6 7 8 9 10 11 12 13 14 15 16 17 18 19 20 21 22 23 24 25 26 27 28 print ('Training SVM with RBF (Gaussian) Kernel (this may take 1 to 2 minutes) ...' )c = 1 sigma = 0.1 def gaussian_kernel (x_1, x_2 ): n1 = x_1.shape[0 ] n2 = x_2.shape[0 ] result = np.zeros((n1, n2)) for i in range (n1): for j in range (n2): result[i, j] = gk.gaussian_kernel(x_1[i], x_2[j], sigma) return result clf = svm.SVC(C=c, kernel=gaussian_kernel) clf.fit(X, y) print ('Training complete!' )pd.plot_data(X, y) vb.visualize_boundary(clf, X, 0 , 1 , .4 , 1.0 ) input ('Program paused. Press ENTER to continue' )
这里是根据高斯核函数的定义,直接手写了一个高斯核函数出来,也可以直接用clf = svm.SVC(C=c, kernel='rbf', gamma=np.power(sigma, -2))调用高斯核函数
决策边界如下:
测试 最后加载一个新的数据集,测试一下高斯核函数
1 2 3 4 5 6 7 8 9 10 11 12 13 14 15 16 17 18 19 20 21 22 23 24 25 26 print ('Loading and Visualizing Data ...' )data = scio.loadmat('ex6data3.mat' ) X = data['X' ] y = data['y' ].flatten() m = y.size pd.plot_data(X, y) plt.show() input ('Program paused. Press ENTER to continue' )clf = svm.SVC(C=c, kernel='rbf' , gamma=np.power(sigma, -2 )) clf.fit(X, y) pd.plot_data(X, y) vb.visualize_boundary(clf, X, -.5 , .3 , -.8 , .6 ) plt.show() input ('ex6 Finished. Press ENTER to exit' )
后半 后半部分文件:
ex6 spam.py - Python脚本,用于练习的后半部分 spamTrain.mat - 垃圾邮件训练集 spamTest.mat - 垃圾邮件测试集 emailSample1.txt - 样本电子邮件1 emailSample2.txt - 样本电子邮件2 spamSample1.txt - 样本垃圾邮件1 spamSample2.txt - 样本垃圾邮件2 vocab.txt - 词汇表 getVocabList.py - 载入词汇表 porterStemmer.py - 词干提取函数 readFile.py - 将文件读入字符字符串
需要补充的文件:
导入 1 2 3 4 5 6 7 import matplotlib.pyplot as pltimport numpy as npimport scipy.io as sciofrom sklearn import svmimport processEmail as peimport emailFeatures as ef
加载 1 2 3 4 5 6 7 8 9 10 11 12 13 14 15 print ('正在预处理示例电子邮件(emailSample1.txt)...' )file_contents = open ('emailSample1.txt' , 'r' ).read() word_indices = pe.process_email(file_contents) print ('单词索引:' )print (word_indices)input ('程序暂停。按回车键继续' )
完成processEmail.py
1 2 3 4 5 6 7 8 9 10 11 12 13 14 15 16 17 18 19 20 21 22 23 24 25 26 27 28 29 30 31 32 33 34 35 36 37 38 39 40 41 42 43 44 45 46 47 48 49 50 51 52 53 54 55 56 57 58 59 60 61 62 63 64 65 66 67 68 69 70 71 72 73 74 75 76 77 78 79 80 81 82 83 import numpy as npimport reimport nltkimport nltk.stem.porterdef process_email (email_contents ): vocab_list = get_vocab_list() word_indices = np.array([], dtype=np.int64) email_contents = email_contents.lower() email_contents = re.sub('<[^<>]+>' , ' ' , email_contents) email_contents = re.sub('[0-9]+' , 'number' , email_contents) email_contents = re.sub('(http|https)://[^\s]*' , 'httpaddr' , email_contents) email_contents = re.sub('[^\s]+@[^\s]+' , 'emailaddr' , email_contents) email_contents = re.sub('[$]+' , 'dollar' , email_contents) print ('==== 处理后的电子邮件 ====' ) stemmer = nltk.stem.porter.PorterStemmer() tokens = re.split('[@$/#.-:&*+=\[\]?!(){\},\'\">_<;% ]' , email_contents) for token in tokens: token = re.sub('[^a-zA-Z0-9]' , '' , token) token = stemmer.stem(token) if len (token) < 1 : continue if token in vocab_list.values(): for key, value in vocab_list.items(): if value == token: index = key break word_indices = np.append(word_indices, index) print (token) print ('==================' ) return word_indices def get_vocab_list (): vocab_dict = {} with open ('vocab.txt' ) as f: for line in f: (val, key) = line.split() vocab_dict[int (val)] = key return vocab_dict
这里的vocab_list会返回一个字典,先利用字典的values方法判断token是否在字典里面,如果在,就遍历字典,找到对应的key,然后记录下key,保存为Index,用append方法添加新word_indices数组里面去
特征提取 1 2 3 4 5 6 7 8 9 10 11 12 13 14 print ('从示例电子邮件(emailSample1.txt)中提取特征...' )features = ef.email_features(word_indices) print ('特征向量的长度:{}' .format (features.size))print ('非零条目的数量:{}' .format (np.flatnonzero(features).size))input ('程序暂停。按回车键继续' )
编写emailFeatures.py
1 2 3 4 5 6 7 8 9 10 11 12 13 14 15 16 17 18 19 20 21 22 23 24 25 26 27 28 29 30 31 32 33 34 35 36 37 38 39 40 41 42 43 44 45 46 47 import numpy as npdef email_features (word_indices ): n = 1899 features = np.zeros(n + 1 ) for index in word_indices: features[index] = 1 return features
遍历word_indices,遇到特征词,变为1即可
线性SVM 1 2 3 4 5 6 7 8 9 10 11 12 13 14 15 16 17 18 19 data = scio.loadmat('spamTrain.mat' ) X = data['X' ] y = data['y' ].flatten() print ('训练线性SVM(垃圾邮件分类)' )print ('(可能需要1到2分钟)' )c = 0.1 clf = svm.SVC(C=c, kernel='linear' ) clf.fit(X, y) p = clf.predict(X) print ('训练准确率:{}' .format (np.mean(p == y) * 100 ))
用线性SVM进行分类
测试 1 2 3 4 5 6 7 8 9 10 11 12 13 14 15 16 data = scio.loadmat('spamTest.mat' ) Xtest = data['Xtest' ] ytest = data['ytest' ].flatten() print ('在测试集上评估经过训练的线性SVM...' )p = clf.predict(Xtest) print ('测试准确率:{}' .format (np.mean(p == ytest) * 100 ))input ('程序暂停。按回车键继续' )
查看预测因子 1 2 3 4 5 6 7 8 9 10 11 12 13 14 vocab_list = pe.get_vocab_list() indices = np.argsort(clf.coef_).flatten()[::-1 ] print (indices)for i in range (15 ): print ('{} ({:0.6f})' .format (vocab_list[indices[i]], clf.coef_.flatten()[indices[i]])) input ('ex6_spam 完成。按回车键退出' )
ndices = np.argsort(clf.coef_).flatten()[::-1]
clf.coef_: 这是训练后模型的权重矩阵。对于线性 SVM,每个特征都有一个相关联的权重。np.argsort(clf.coef_): 这一步是对权重进行排序,返回的是排序后的索引。在默认情况下,argsort 返回的是从小到大排列的索引。由于我们关心权重最高的单词,我们需要将索引按照权重的降序排列,因此我们使用 [::-1] 对数组进行逆序。flatten(): 这一步是将排序后的索引数组扁平化,将其变为一维数组。在这里,我们希望得到一个简单的一维数组,以便后续的处理。
