8.5 ex4:bias vs variance 概述 在本练习的前半部分,你将实现正则化线性回归,用于预测水库中水位变化与水流出量之间的关系。在接下来的一半中,你将进行一些调试学习算法的诊断,并研究偏差与方差的影响。
必要的文件如下:
ex5.py - Python脚本,通过练习的步骤引导您ex5data1.mat - 数据集 featureNormalize.py - 特征归一化函数plotFit.py - 绘制多项式拟合图 trainLinearReg.py - 使用您的成本函数训练线性回归
需要完成的文件如下:
linearRegCostFunction.py - 正则化线性回归成本函数learningCurve.py - 生成学习曲线polyFeatures.py - 将数据映射到多项式特征空间 validationCurve.py - 生成交叉验证曲线
导入 1 2 3 4 5 6 7 8 9 10 import matplotlib.pyplot as pltimport numpy as npimport scipy.io as scioimport linearRegCostFunction as lrcfimport trainLinearReg as tlrimport learningCurve as lcimport polyFeatures as pfimport featureNormalize as fnimport plotFit as plotftimport validationCurve as vc
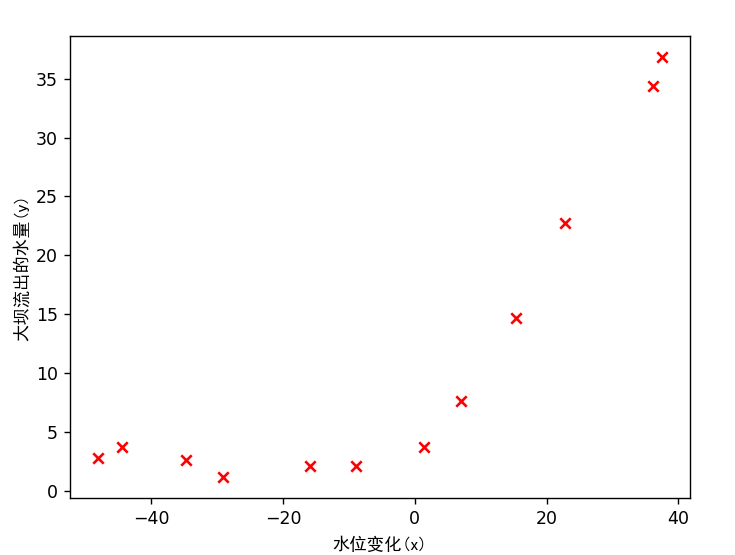
加载和绘图 1 2 3 4 5 6 7 8 9 10 11 12 13 print ('加载和可视化数据...' )data = scio.loadmat('ex5data1.mat' ) X = data['X' ] y = data['y' ].flatten() Xval = data['Xval' ] yval = data['yval' ].flatten() Xtest = data['Xtest' ] ytest = data['ytest' ].flatten() m = y.size
data数据集分为三个部分:
用于模型学习的训练集:X, y
用于确定正则化参数的交叉验证集:Xval, yval
用于评估性能的测试集。这些是在训练期间模型未见过的“未知”示例:Xtest, ytest
1 2 3 4 5 6 7 plt.figure() plt.scatter(X, y, c='r' , marker="x" ) plt.xlabel('水位变化(x)' ,fontproperties='SimHei' ) plt.ylabel('大坝流出的水量(y)' ,fontproperties='SimHei' ) plt.show() input ('程序暂停。按ENTER键继续' )
正则化线性回归 现在应该完善linearRegCostFunction.py文件,实现线性回归功能
1 2 3 4 5 6 7 8 9 10 11 12 13 14 15 16 17 18 19 20 21 22 23 24 25 26 27 import numpy as npdef linear_reg_cost_function (theta, x, y, lmd ): m = y.size cost = 0 grad = np.zeros(theta.shape) error = x @ theta - y reg = lmd * np.sum (np.power(theta[1 :], 2 )) cost = (np.sum (error**2 ) + reg) / (2 * m) grad = (error @ x) / m grad[1 :] += lmd * theta[1 :] / m return cost, grad
正则化的线性回归在之前的练习中就已经写过,所有可以很顺利的写出
注意:正则化是不包含$\theta_0$的
1 2 3 4 5 6 7 8 9 10 11 12 13 14 15 16 17 18 19 20 21 22 theta = np.ones(2 ) cost, _ = lrcf.linear_reg_cost_function(theta, np.c_[np.ones(m), X], y, 1 ) print ('theta = [1 1] 时的代价: {:0.6f}\n(该值应约为303.993192)' .format (cost))input ('程序暂停。按ENTER键继续' )theta = np.ones(2 ) cost, grad = lrcf.linear_reg_cost_function(theta, np.c_[np.ones(m), X], y, 1 ) print ('theta = [1 1] 时的梯度: {}\n(该值应约为[-15.303016 598.250744])' .format (grad))input ('程序暂停。按ENTER键继续' )
执行测试程序,观察程序的结果是否等于理想的值
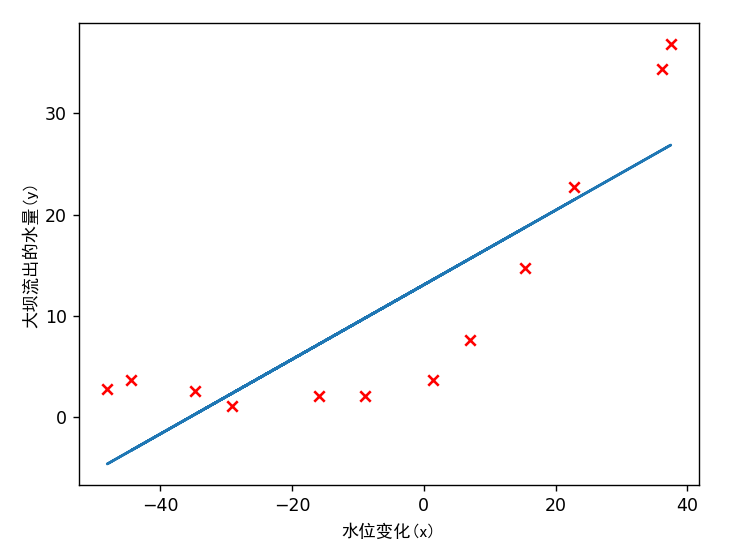
1 2 3 4 5 6 7 8 9 10 11 12 13 lmd = 0 theta = tlr.train_linear_reg(np.c_[np.ones(m), X], y, lmd) plt.plot(X, np.dot(np.c_[np.ones(m), X], theta)) input ('程序暂停。按ENTER键继续' )
画出拟合曲线
学习曲线 完善trainLinearReg.py文件,绘制出学习曲线的图
1 2 3 4 5 6 7 8 9 10 11 12 13 14 15 16 17 18 19 20 21 22 23 24 25 26 27 28 import numpy as npimport trainLinearReg as tlrimport linearRegCostFunction as lrcfdef learning_curve (X, y, Xval, yval, lmd ): m = X.shape[0 ] error_train = np.zeros(m) error_val = np.zeros(m) for i in range (1 , m + 1 ): X_subset = X[:i, :] y_subset = y[:i] theta = tlr.train_linear_reg(X_subset, y_subset, lmd) error_train[i - 1 ], _ = lrcf.linear_reg_cost_function(theta, X_subset, y_subset, 0 ) error_val[i - 1 ], _ = lrcf.linear_reg_cost_function(theta, Xval, yval, 0 ) return error_train, error_val
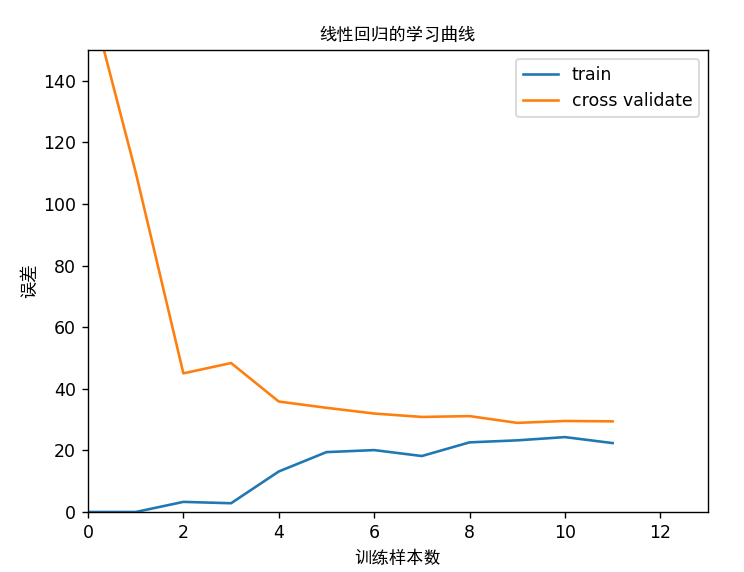
这里使用for循环,逐渐增加训练集和验证集的样本数m,然后把误差存储在error_train和error_val数组中,从而绘制出随着m增加,误差变化的学习曲线
1 2 3 4 5 6 7 8 9 10 11 12 13 lmd = 0 error_train, error_val = lc.learning_curve(np.c_[np.ones(m), X], y, np.c_[np.ones(Xval.shape[0 ]), Xval], yval, lmd) plt.figure() plt.plot(np.arange(m), error_train, np.arange(m), error_val) plt.title('线性回归的学习曲线' ,fontproperties='SimHei' ) plt.legend(['train' , 'cross validate' ]) plt.xlabel('训练样本数' ,fontproperties='SimHei' ) plt.ylabel('误差' ,fontproperties='SimHei' ) plt.axis([0 , 13 , 0 , 150 ]) plt.show() input ('程序暂停。按ENTER键继续' )
绘制学习曲线
可以看到,虽然训练样本数的增加,训练集的误差越来越大,最后趋于平缓,而验证集的误差越来越小,最后也趋于平缓
多项式回归的特征映射 1 2 3 4 5 6 7 8 9 10 11 12 13 14 15 16 17 18 19 20 21 22 23 24 25 26 27 28 29 30 31 32 33 34 35 p = 5 X_poly = pf.poly_features(X, p) X_poly, mu, sigma = fn.feature_normalize(X_poly) X_poly = np.c_[np.ones(m), X_poly] X_poly_test = pf.poly_features(Xtest, p) X_poly_test -= mu X_poly_test /= sigma X_poly_test = np.c_[np.ones(X_poly_test.shape[0 ]), X_poly_test] X_poly_val = pf.poly_features(Xval, p) X_poly_val -= mu X_poly_val /= sigma X_poly_val = np.c_[np.ones(X_poly_val.shape[0 ]), X_poly_val] print ('归一化后的训练样本 1 : \n{}' .format (X_poly[0 ]))input ('程序暂停。按ENTER键继续' )
feature_normalize.py是已经给出的python文件,只需要完成polyFeatures即行
1 2 3 4 5 6 7 8 9 10 11 12 13 14 15 16 17 18 19 20 import numpy as npdef poly_features (X, p ): X_poly = np.zeros((X.size, p)) for i in range (p): X_poly[:, i] = np.power(X, i + 1 ).flatten() return X_poly """ 假设p=2,那么会输出 [x, y, z x²,y²,z²] """
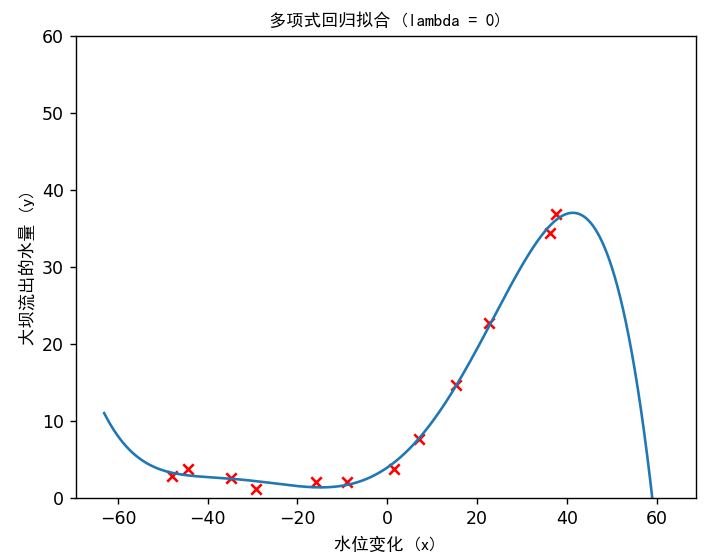
多项式回归的学习曲线 1 2 3 4 5 6 7 8 9 10 11 12 13 14 15 lmd = 0 theta = tlr.train_linear_reg(X_poly, y, lmd) plt.figure() plt.scatter(X, y, c='r' , marker="x" ) plotft.plot_fit(np.min (X), np.max (X), mu, sigma, theta, p) plt.xlabel('水位变化 (x)' ,fontproperties='SimHei' ) plt.ylabel('大坝流出的水量 (y)' ,fontproperties='SimHei' ) plt.ylim([0 , 60 ]) plt.title('多项式回归拟合 (lambda = {})' .format (lmd),fontproperties='SimHei' )
train_linear_reg和plot_fit都是已经给出的函数,可以直接调用进行绘图
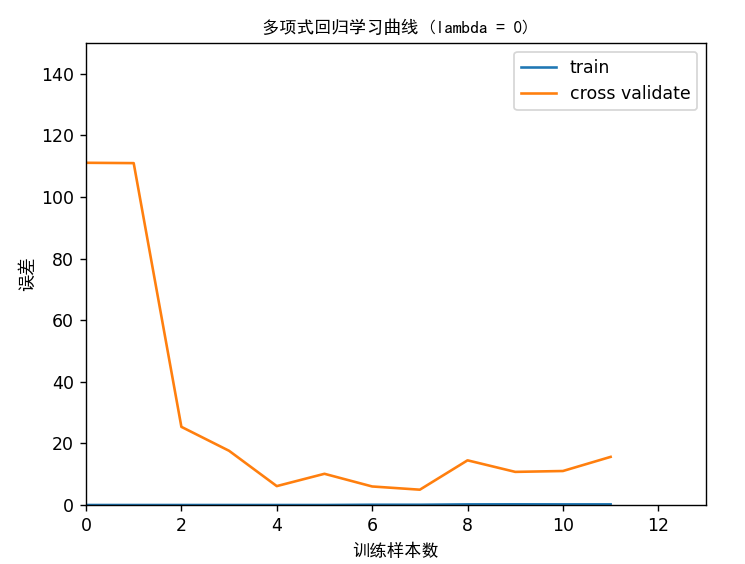
然后绘制多项式回归的学习曲线
1 2 3 4 5 6 7 8 9 10 11 12 13 14 15 error_train, error_val = lc.learning_curve(X_poly, y, X_poly_val, yval, lmd) plt.figure() plt.plot(np.arange(m), error_train, np.arange(m), error_val) plt.title('多项式回归学习曲线 (lambda = {})' .format (lmd),fontproperties='SimHei' ) plt.legend(['train' , 'cross validate' ]) plt.xlabel('训练样本数' ,fontproperties='SimHei' ) plt.ylabel('误差' ,fontproperties='SimHei' ) plt.axis([0 , 13 , 0 , 150 ]) plt.show() print ('多项式回归 (lambda = {})' .format (lmd))print ('# 训练样本数\t训练误差\t\t交叉验证误差' )for i in range (m): print (' \t{}\t\t{}\t{}' .format (i, error_train[i], error_val[i])) input ('程序暂停。按ENTER键继续' )
用之前编写的learning_curve函数,计算出error_train, error_val,然后绘制绘图
可以看出,训练集的误差在训练样本不断增大的情况下,误差都很小,而在验证集上,随着训练样本的增大,误差有明显下降,说明训练集存在高方差的问题,即过拟合
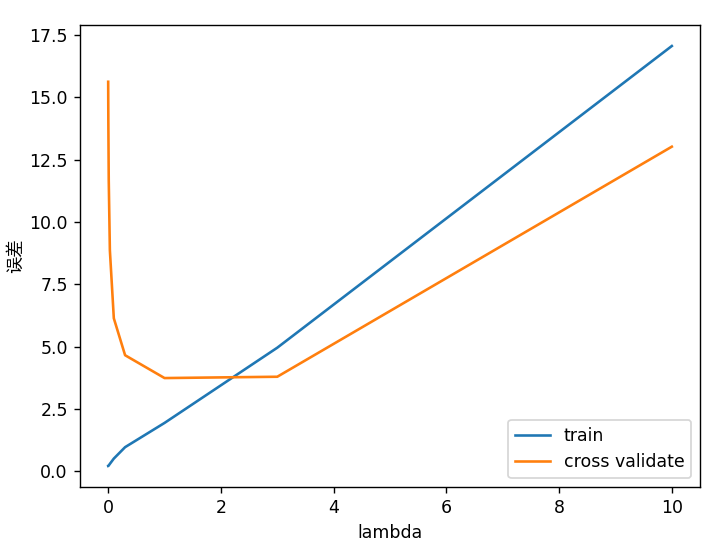
测试lambda值 1 2 3 4 5 6 7 8 9 10 11 12 13 lambda_vec, error_train, error_val = vc.validation_curve(X_poly, y, X_poly_val, yval) plt.figure() plt.plot(lambda_vec, error_train, lambda_vec, error_val) plt.legend(['train' , 'cross validate' ]) plt.xlabel('lambda' ) plt.ylabel('误差' ,fontproperties='SimHei' ) plt.show() input ('ex5 完成。按ENTER键退出' )
编写validationCurve.py文件
1 2 3 4 5 6 7 8 9 10 11 12 13 14 15 16 17 18 19 20 21 22 23 24 25 26 27 28 29 import numpy as npimport trainLinearReg as tlrimport linearRegCostFunction as lrcfdef validation_curve (X, y, Xval, yval ): lambda_vec = np.array([0. , 0.001 , 0.003 , 0.01 , 0.03 , 0.1 , 0.3 , 1 , 3 , 10 ]) m=len (lambda_vec) error_train = np.zeros(lambda_vec.size) error_val = np.zeros(lambda_vec.size) for i in range (m): lmd = lambda_vec[i] theta = tlr.train_linear_reg(X, y, lmd) error_train[i], _ = lrcf.linear_reg_cost_function(theta, X, y, 0 ) error_val[i], _ = lrcf.linear_reg_cost_function(theta, Xval, yval, 0 ) return lambda_vec, error_train, error_val
把不同lambda值对应的训练误差和验证误差都求出来,并绘制曲线图
可以看见,随着lambda的增大,验证集的误差先较小后增加,而训练集的误差一直在增加,说明适当的lambda的值降低了过拟合程度,而过大的lambda值让函数欠拟合
