ex8:anomaly detection and recommendation
异常检测
概述
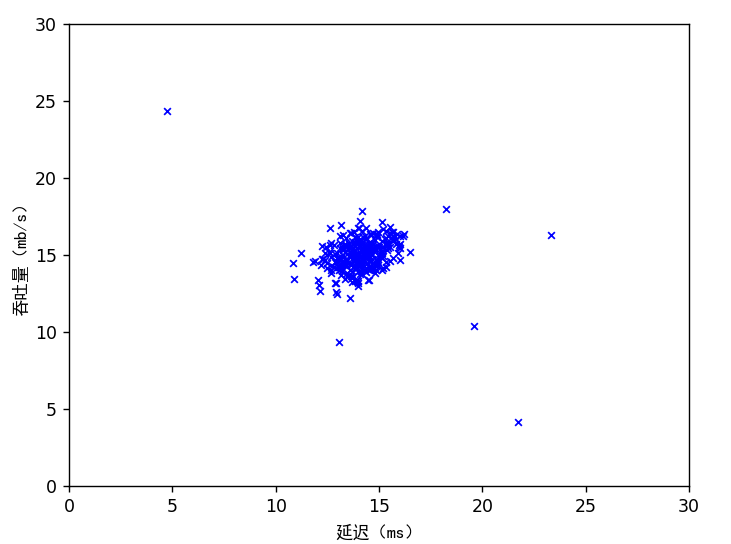
在这个练习中,您将实现异常检测算法并将其应用于检测网络上的故障服务器
必要的文件:
ex8.py - 用于练习第一部分的Python脚本ex8data1.mat - 用于异常检测的第一个示例数据集 ex8data2.mat - 用于异常检测的第二个示例数据集multivariateGaussian.py - 计算高斯分布的概率密度函数visualizeFit.py - 高斯分布和数据集的二维图
需要补充的文件:
estimateGaussian.py - 估算带有对角协方差矩阵的高斯分布的参数selectThreshold.py - 为异常检测找到阈值
导入
1
2
3
4
5
6
7
8
9
| import matplotlib.pyplot as plt
import numpy as np
import scipy.io as scio
import estimateGaussian as eg
import multivariateGaussian as mvg
import visualizeFit as vf
import selectThreshold as st
|
载入并绘图
1
2
3
4
5
6
7
8
9
10
11
12
13
14
15
16
17
18
19
20
21
22
|
print('正在可视化用于异常检测的示例数据集.')
data = scio.loadmat('ex8data1.mat')
X = data['X']
Xval = data['Xval']
yval = data['yval'].flatten()
plt.figure()
plt.scatter(X[:, 0], X[:, 1], c='b', marker='x', s=15, linewidth=1)
plt.axis([0, 30, 0, 30])
plt.xlabel('延迟(ms)',fontproperties='SimHei')
plt.ylabel('吞吐量(mb/s)',fontproperties='SimHei')
plt.show()
input('程序暂停。按回车键继续')
|

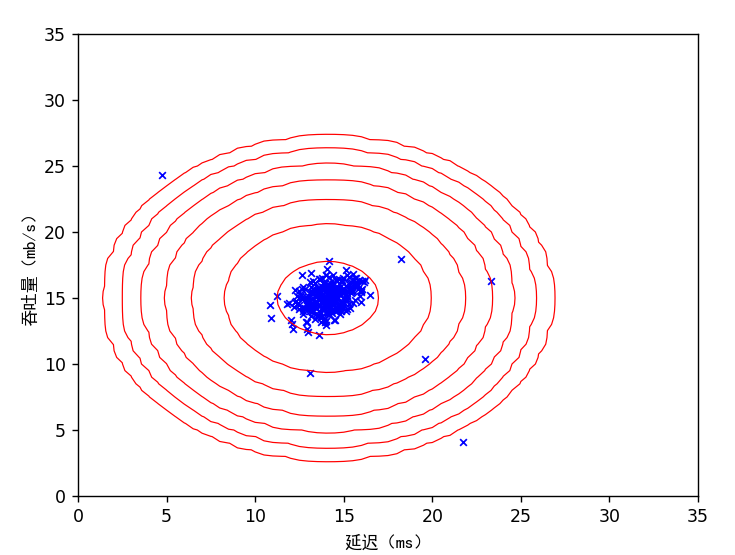
高斯拟合
首先编写高斯拟合的python文件:estimateGaussian.py
1
2
3
4
5
6
7
8
9
10
11
12
13
14
15
16
17
18
19
20
21
22
| import numpy as np
def estimate_gaussian(X):
m, n = X.shape
mu = np.zeros(n)
sigma2 = np.zeros(n)
for i in range(n):
mu[i]=np.sum(X[:,i])/m
sigma2[i]=np.sum((X[:,i]-mu[i])**2)/m
return mu, sigma2
|
找到$\sigma$和$\mu^2$,然后代入已经写好的multivariate_gaussian函数中,直接算出概率p
1
2
3
4
5
6
7
8
9
10
11
12
13
14
15
16
17
18
19
20
21
|
print('正在可视化高斯拟合.')
mu, sigma2 = eg.estimate_gaussian(X)
p = mvg.multivariate_gaussian(X, mu, sigma2)
vf.visualize_fit(X, mu, sigma2)
plt.xlabel('延迟(ms)',fontproperties='SimHei')
plt.ylabel('吞吐量(mb/s)',fontproperties='SimHei')
input('程序暂停。按回车键继续')
|

查找异常值
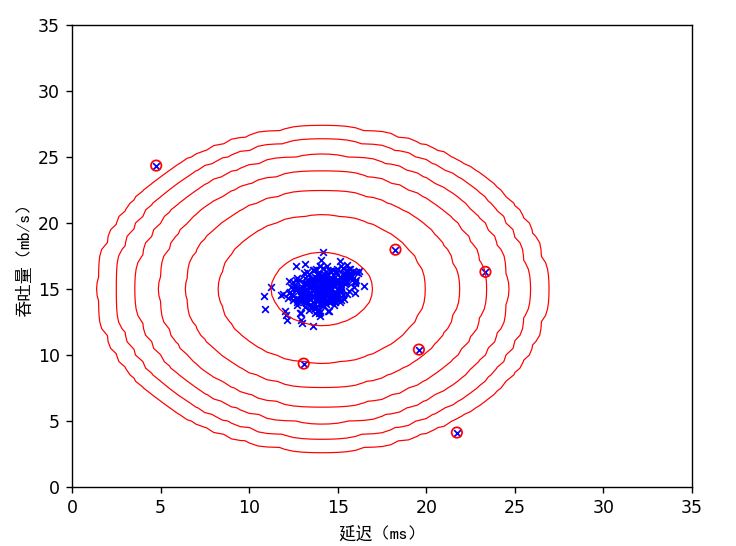
完成selectThreshold.py函数,根据概率pval和真实值yval,找出最佳的$\epsilon$
1
2
3
4
5
6
7
8
9
10
11
12
13
14
15
16
17
18
19
20
21
22
23
24
25
26
27
28
29
30
31
32
33
34
35
36
37
38
39
40
41
| import numpy as np
def select_threshold(yval, pval):
f1 = 0
best_eps = 0
best_f1 = 0
for epsilon in np.linspace(np.min(pval), np.max(pval), num=1001):
tp = np.sum((yval == 1) & (pval < epsilon))
fp = np.sum((yval == 0) & (pval < epsilon))
fn = np.sum((yval == 1) & (pval >= epsilon))
precision = tp / (tp + fp) if (tp + fp) > 0 else 0
recall = tp / (tp + fn) if (tp + fn) > 0 else 0
f1 = 2 * precision * recall / (precision + recall) if (precision + recall) > 0 else 0
if f1 > best_f1:
best_f1 = f1
best_eps = epsilon
return best_eps, best_f1
|
直接用np.sum((yval == 1) & (pval < epsilon))的语法,让两个布尔数组进行与操作,然后相加,就可以得到真正例tp,非常精妙
回到ex8.py中
1
2
3
4
5
6
7
8
9
10
11
12
13
14
15
16
|
pval = mvg.multivariate_gaussian(Xval, mu, sigma2)
epsilon, f1 = st.select_threshold(yval, pval)
print('使用交叉验证找到的最佳 epsilon 值:{:0.4e}'.format(epsilon))
print('交叉验证集上的最佳 F1 值:{:0.6f}'.format(f1))
print('(您应该看到 epsilon 约为 8.99e-05,F1 约为 0.875)')
outliers = np.where(p < epsilon)
plt.scatter(X[outliers, 0], X[outliers, 1], marker='o', facecolors='none', edgecolors='r')
plt.show()
input('程序暂停。按回车键继续')
|

测试
最后使用之前写的代码,代入数据集2中进行测试:
1
2
3
4
5
6
7
8
9
10
11
12
13
14
15
16
17
18
19
20
21
22
23
24
25
26
27
28
|
data = scio.loadmat('ex8data2.mat')
X = data['X']
Xval = data['Xval']
yval = data['yval'].flatten()
mu, sigma2 = eg.estimate_gaussian(X)
p = mvg.multivariate_gaussian(X, mu, sigma2)
pval = mvg.multivariate_gaussian(Xval, mu, sigma2)
epsilon, f1 = st.select_threshold(yval, pval)
print('使用交叉验证找到的最佳 epsilon 值:{:0.4e}'.format(epsilon))
print('交叉验证集上的最佳 F1 值:{:0.6f}'.format(f1))
print('发现的异常值数量:{}'.format(np.sum(np.less(p, epsilon))))
print('(您应该看到 epsilon 约为 1.38e-18,F1 约为 0.615,以及 117 个异常值)')
input('ex8 完成。按回车键退出')
|
np.less(p, epsilon): 这部分代码使用NumPy库中的np.less()函数,它会逐元素比较数组p中的每个元素是否小于epsilon。这将生成一个布尔值的数组,其中True表示对应位置的元素小于epsilon,False表示大于或等于epsilon。
推荐系统
概述
在第二部分中,您将使用协同过滤构建电影推荐系统
必要的文件:
ex8_cofi.py - 用于练习第二部分的Python脚本ex8 movies.mat - 电影评论数据集 ex8 movieParams.mat - 用于调试的参数checkCostFunction.py - 协同过滤的梯度loadMovieList.py - 将电影列表加载到单元数组中 movie_ids.txt - 电影列表 normalizeRatings.py - 协同过滤的均值归一化computeNumericalGradient.py - 数值计算梯度
需要补充的文件:
cofiCostFunc.py - 实现协同过滤的成本函数
导入
1
2
3
4
5
6
7
8
9
10
| import matplotlib.pyplot as plt
import numpy as np
import scipy.io as scio
import scipy.optimize as opt
import cofiCostFunction as ccf
import checkCostFunction as cf
import loadMovieList as lm
import normalizeRatings as nr
|
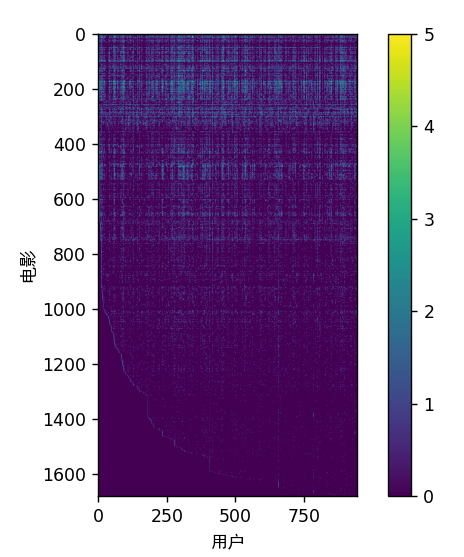
载入并绘图
1
2
3
4
5
6
7
8
9
10
11
12
13
14
15
16
17
18
19
20
21
22
23
24
25
|
print('加载电影评分数据集.')
data = scio.loadmat('ex8_movies.mat')
Y = data['Y']
R = data['R']
print('电影 0(Toy Story)的平均评分: {:0.6f}/5'.format(np.mean(Y[0, np.where(R[0] == 1)])))
plt.figure()
plt.imshow(Y)
plt.colorbar()
plt.xlabel('用户',fontproperties='SimHei')
plt.ylabel('电影',fontproperties='SimHei')
plt.show()
input('程序暂停。按回车键继续')
|

成本函数
需要完成成本函数cofiCostFunc.py文件
1
2
3
4
5
6
7
8
9
10
11
12
13
14
15
16
17
18
19
20
21
22
23
24
25
26
27
28
29
30
31
32
33
34
35
36
37
38
39
| import numpy as np
def cofi_cost_function(params, Y, R, num_users, num_movies, num_features, lmd):
X = params[0:num_movies * num_features].reshape((num_movies, num_features))
theta = params[num_movies * num_features:].reshape((num_users, num_features))
cost = 0
X_grad = np.zeros(X.shape)
theta_grad = np.zeros(theta.shape)
error = (X @ theta.T - Y) * R
cost = 0.5 * np.sum(error ** 2) + 0.5 * lmd * (np.sum(theta ** 2) + np.sum(X ** 2))
X_grad = error @ theta + lmd * X
theta_grad = error.T @ X + lmd * theta
grad = np.concatenate((X_grad.flatten(), theta_grad.flatten()))
return cost, grad
|
回到ex8_cofi.py文件
1
2
3
4
5
6
7
8
9
10
11
12
13
14
15
16
17
18
19
20
21
22
23
24
25
26
27
28
29
|
data = scio.loadmat('ex8_movieParams.mat')
X = data['X']
theta = data['Theta']
num_users = data['num_users']
num_movies = data['num_movies']
num_features = data['num_features']
num_users = 4
num_movies = 5
num_features = 3
X = X[0:num_movies, 0:num_features]
theta = theta[0:num_users, 0:num_features]
Y = Y[0:num_movies, 0:num_users]
R = R[0:num_movies, 0:num_users]
cost, grad = ccf.cofi_cost_function(np.concatenate((X.flatten(), theta.flatten())), Y, R, num_users, num_movies, num_features, 0)
print('加载参数的成本: {:0.2f}\n(这个值应该约为 22.22)'.format(cost))
input('程序暂停。按回车键继续')
|
正则化
1
2
3
4
5
6
7
8
9
10
11
12
13
14
15
16
17
18
19
20
21
22
23
|
cost, _ = ccf.cofi_cost_function(np.concatenate((X.flatten(), theta.flatten())), Y, R, num_users, num_movies, num_features, 1.5)
print('加载参数的成本(lambda = 1.5): {:0.2f}\n'
'(这个值应该约为 31.34)'.format(cost))
input('程序暂停。按回车键继续')
print('检查梯度(带正则化)...')
cf.check_cost_function(1.5)
input('程序暂停。按回车键继续')
|
新用户打分
1
2
3
4
5
6
7
8
9
10
11
12
13
14
15
16
17
18
19
20
21
22
23
24
25
26
27
28
29
30
31
32
33
|
movie_list = lm.load_movie_list()
my_ratings = np.zeros(len(movie_list))
my_ratings[0] = 4
my_ratings[97] = 2
my_ratings[6] = 3
my_ratings[11] = 5
my_ratings[53] = 4
my_ratings[63] = 5
my_ratings[65] = 3
my_ratings[68] = 5
my_ratings[182] = 4
my_ratings[225] = 5
my_ratings[354] = 5
print('新用户的评分:\n')
for i in range(my_ratings.size):
if my_ratings[i] > 0:
print('对 {} 评分为 {}'.format(movie_list[i], my_ratings[i]))
input('程序暂停。按回车键继续')
|
学习评分
1
2
3
4
5
6
7
8
9
10
11
12
13
14
15
16
17
18
19
20
21
22
23
24
25
26
27
28
29
30
31
32
33
34
35
36
37
38
39
40
41
42
43
44
45
46
47
48
49
50
51
52
53
54
|
print('训练协同过滤...\n'
'(这可能需要 1 ~ 2 分钟)')
data = scio.loadmat('ex8_movies.mat')
Y = data['Y']
R = data['R']
Y = np.c_[my_ratings, Y]
R = np.c_[(my_ratings != 0), R]
Ynorm, Ymean = nr.normalize_ratings(Y, R)
num_users = Y.shape[1]
num_movies = Y.shape[0]
num_features = 10
X = np.random.randn(num_movies, num_features)
theta = np.random.randn(num_users, num_features)
initial_params = np.concatenate([X.flatten(), theta.flatten()])
lmd = 10
def cost_func(p):
return ccf.cofi_cost_function(p, Ynorm, R, num_users, num_movies, num_features, lmd)[0]
def grad_func(p):
return ccf.cofi_cost_function(p, Ynorm, R, num_users, num_movies, num_features, lmd)[1]
theta, *unused = opt.fmin_cg(cost_func, fprime=grad_func, x0=initial_params, maxiter=100, disp=False, full_output=True)
X = theta[0:num_movies * num_features].reshape((num_movies, num_features))
theta = theta[num_movies * num_features:].reshape((num_users, num_features))
print('推荐系统学习完成')
print(theta)
input('程序暂停。按回车键继续')
|
推荐电影
1
2
3
4
5
6
7
8
9
10
11
12
13
14
15
16
17
18
|
p = np.dot(X, theta.T)
my_predictions = p[:, 0] + Ymean
indices = np.argsort(my_predictions)[::-1]
print('\n为你推荐的前 10 部电影:')
for i in range(10):
j = indices[i]
print('预测评分 {:0.1f} 给电影 {}'.format(my_predictions[j], movie_list[j]))
print('\n原始评分:')
for i in range(my_ratings.size):
if my_ratings[i] > 0:
print('对 {} 评分为 {}'.format(movie_list[i], my_ratings[i]))
input('ex8_cofi 完成。按回车键退出')
|


